Analytics workbench
We’re most proud of our Analytics Workbench, home-base for real-time analytics and advanced data visualizations. Designed by researchers for researchers, the Analytics Workbench Combines State-of-the-art analytic capabilities with an intuitive interface. Rip through complex survey datasets, expose critical findings and automatically generate highly visual charts, graphs, heatmaps and other visualizations that pinpoint and expose critical findings.
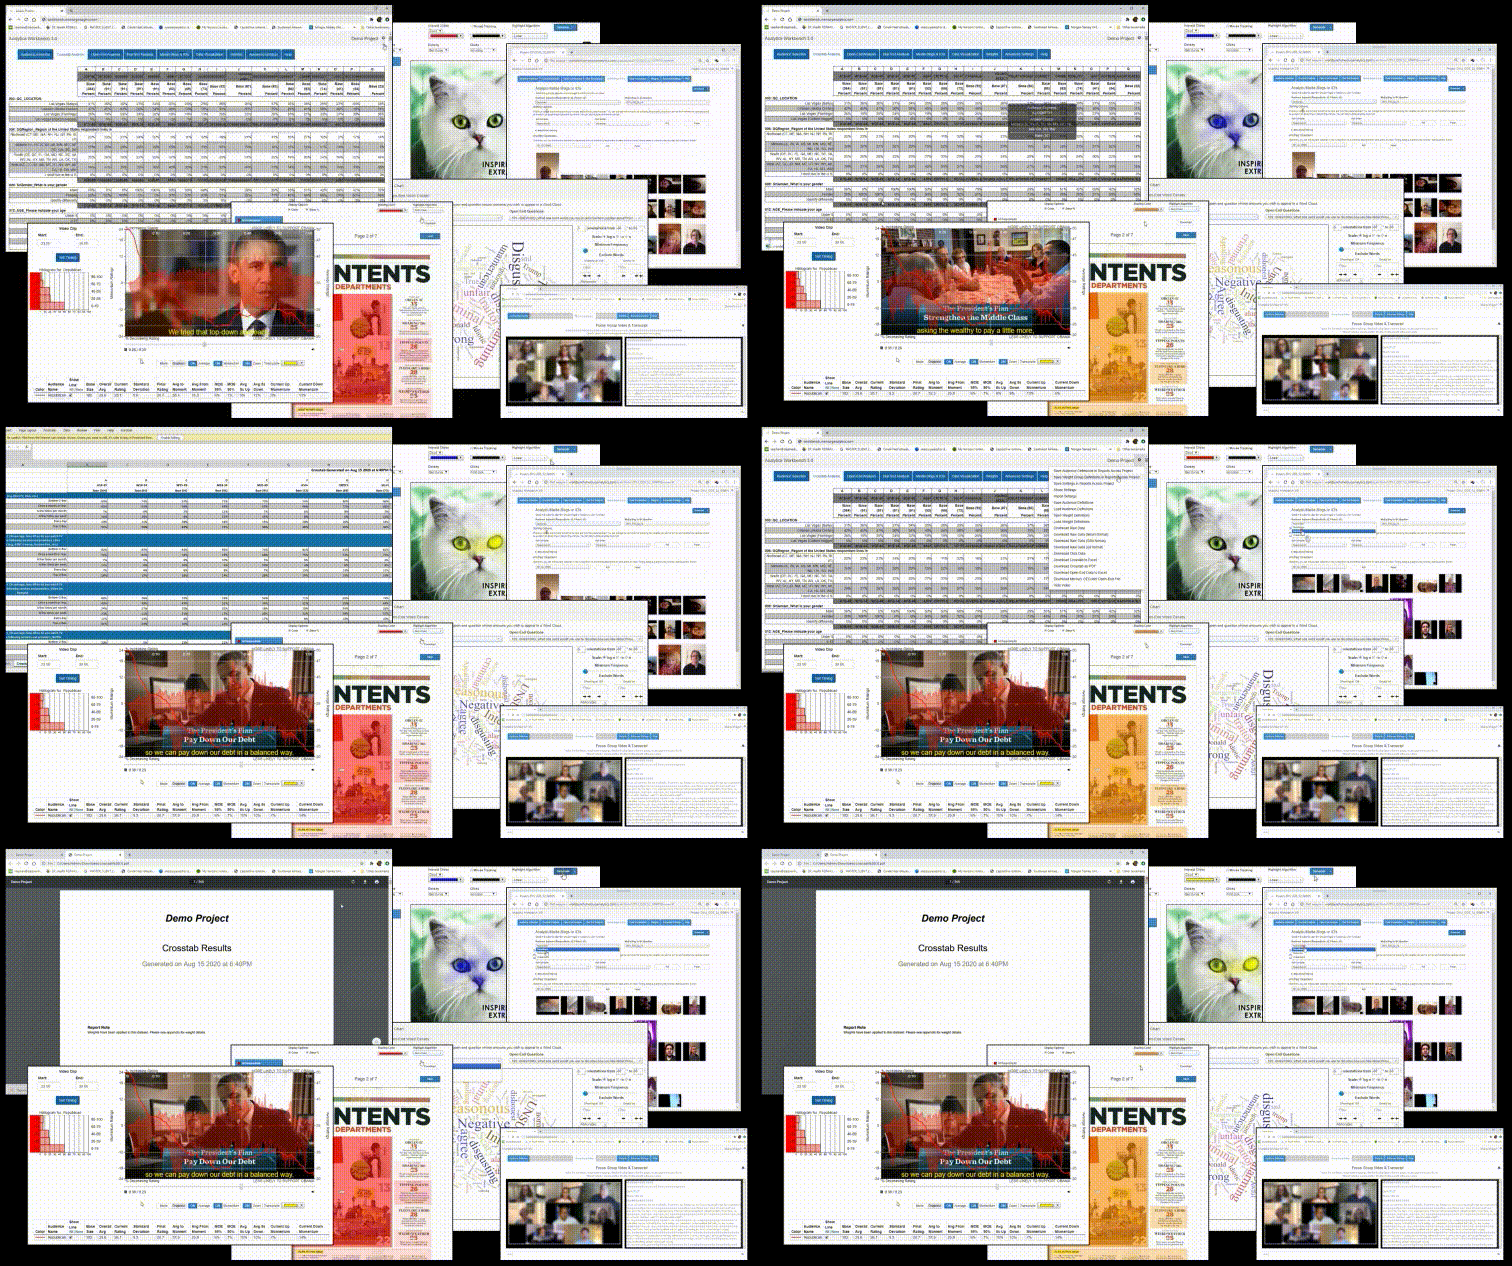
Analytics Workbench: Key Features
The Analytics Workbench gives you real-time access to survey data. Define sets of key banner points and watch as your survey fields by checking crosstabs, open-end responses, as well as advanced data visualizations. Setup weights in minutes and enable significance testing with a click. Share your definitions with team members.
- Point and click banner and audience definitions
- Save and share audience definition sets across projects
- Interactive or downloadable crosstabs, summary tables, open-end reports, word clouds and other data visualizations
- Interactive and downloadable dial-test videos overlay videos and images, message test “hostage note style” heatmaps
- Live Labs focus group video recordings and searchable transcripts
- Auto-data weighting and significance testing
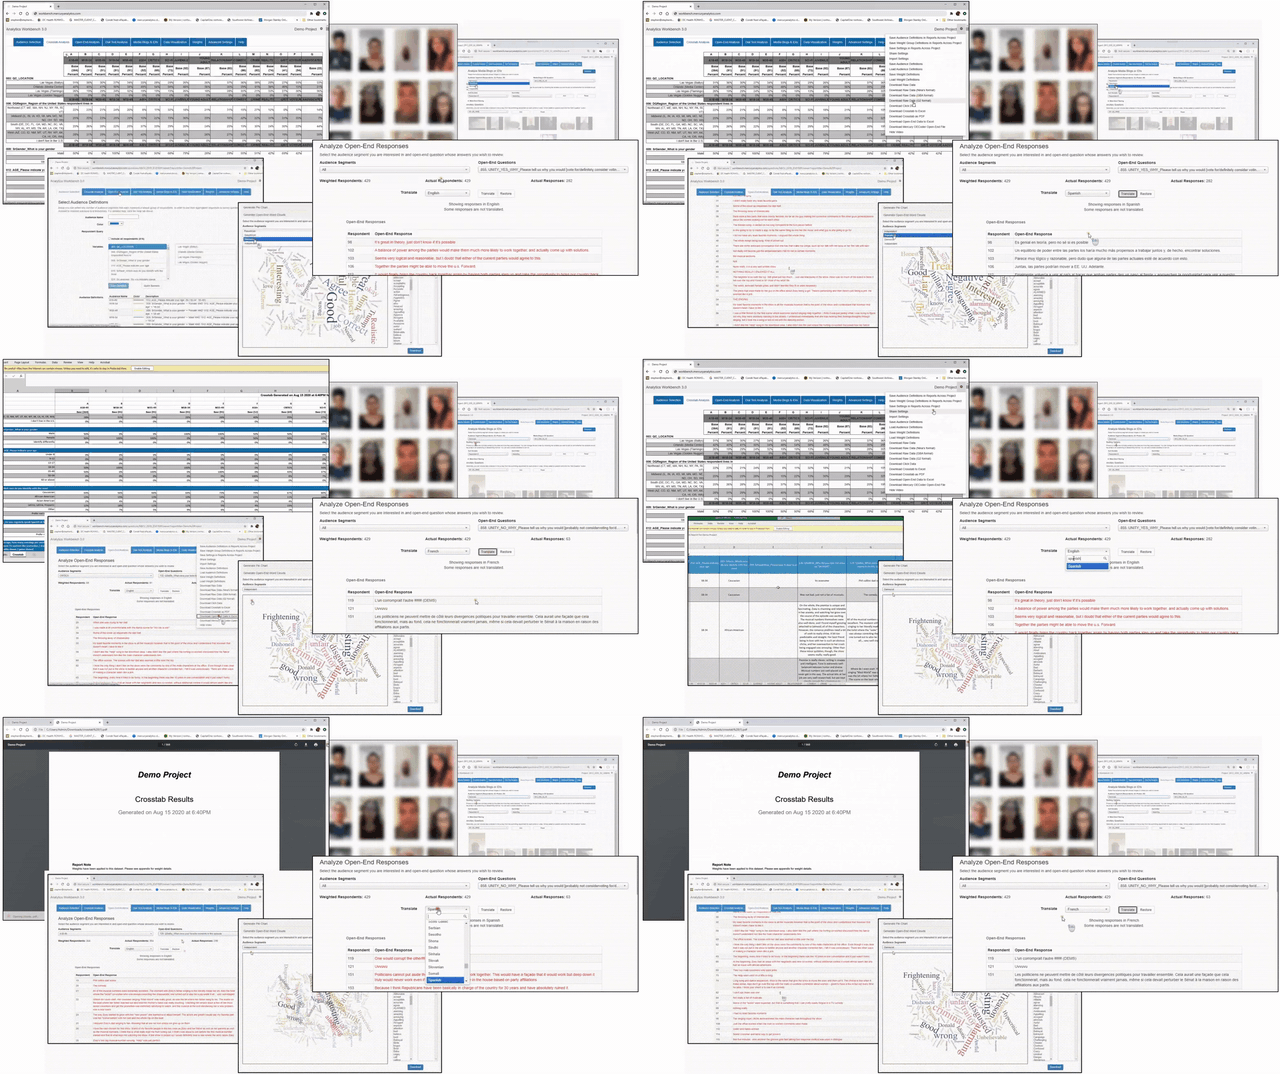
CROSSTABS & QUALITATIVE ANALYSIS TOOLS
At any moment, dig into survey data instantly by viewing or downloading crosstabs and summary tables, weighted or unweighted, with or without significance testing, including cell base sizes or just percentages. Analyze open-end responses by audience segment, with word-clouds, with one-click auto language translation.
DIAL TEST,
IMAGE TEST,
MESSAGE TEST VISUALIZATIONS
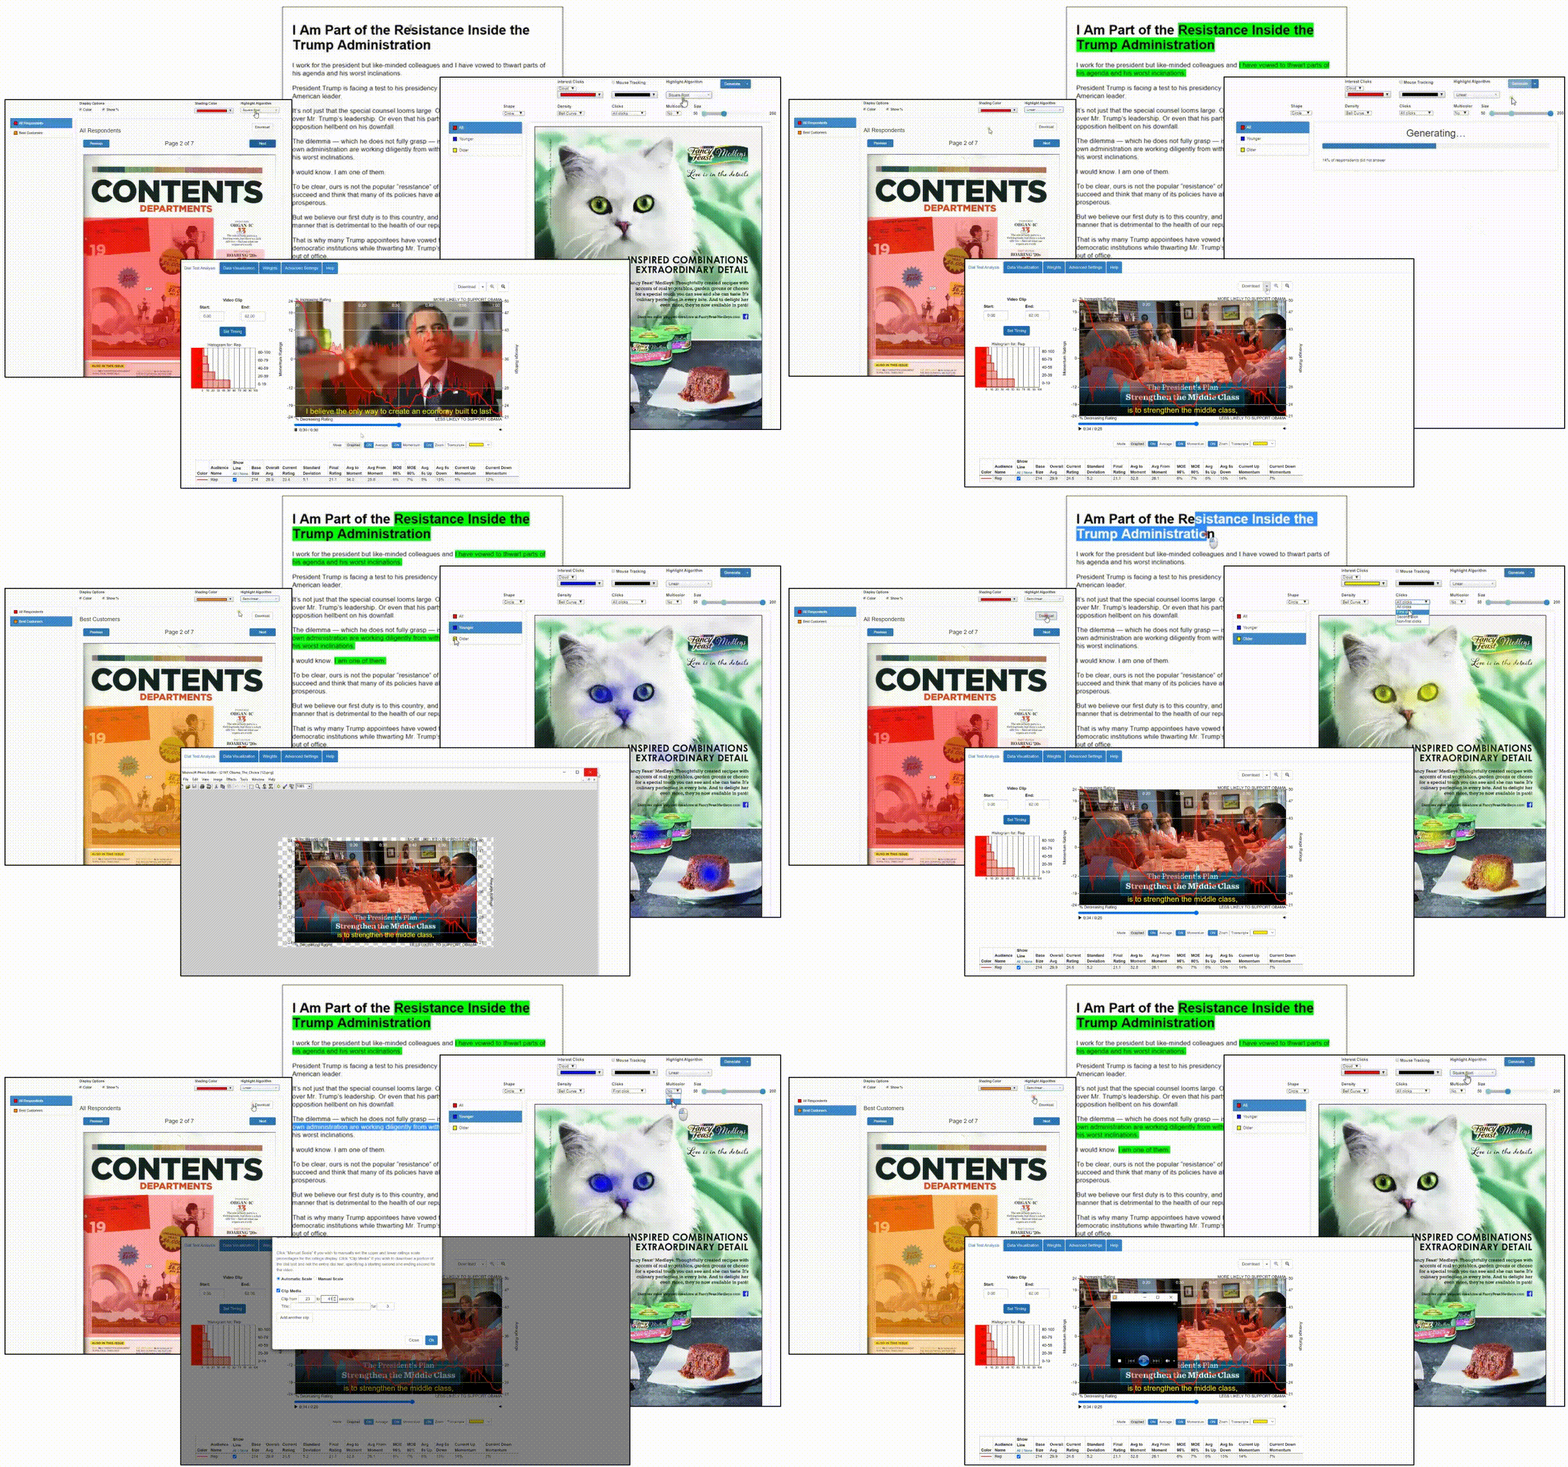
In real-time, view advanced video and audio dial-test and message test results for any audience segments. Click and download key moment images within a dial-test or complete video overlays, with or without closed captions or advanced momentum analysis. See or download image or message heat-maps that visualize critical preferences by audience segment using a wide range of visualization options.
Live labs: Qualitative Analytics
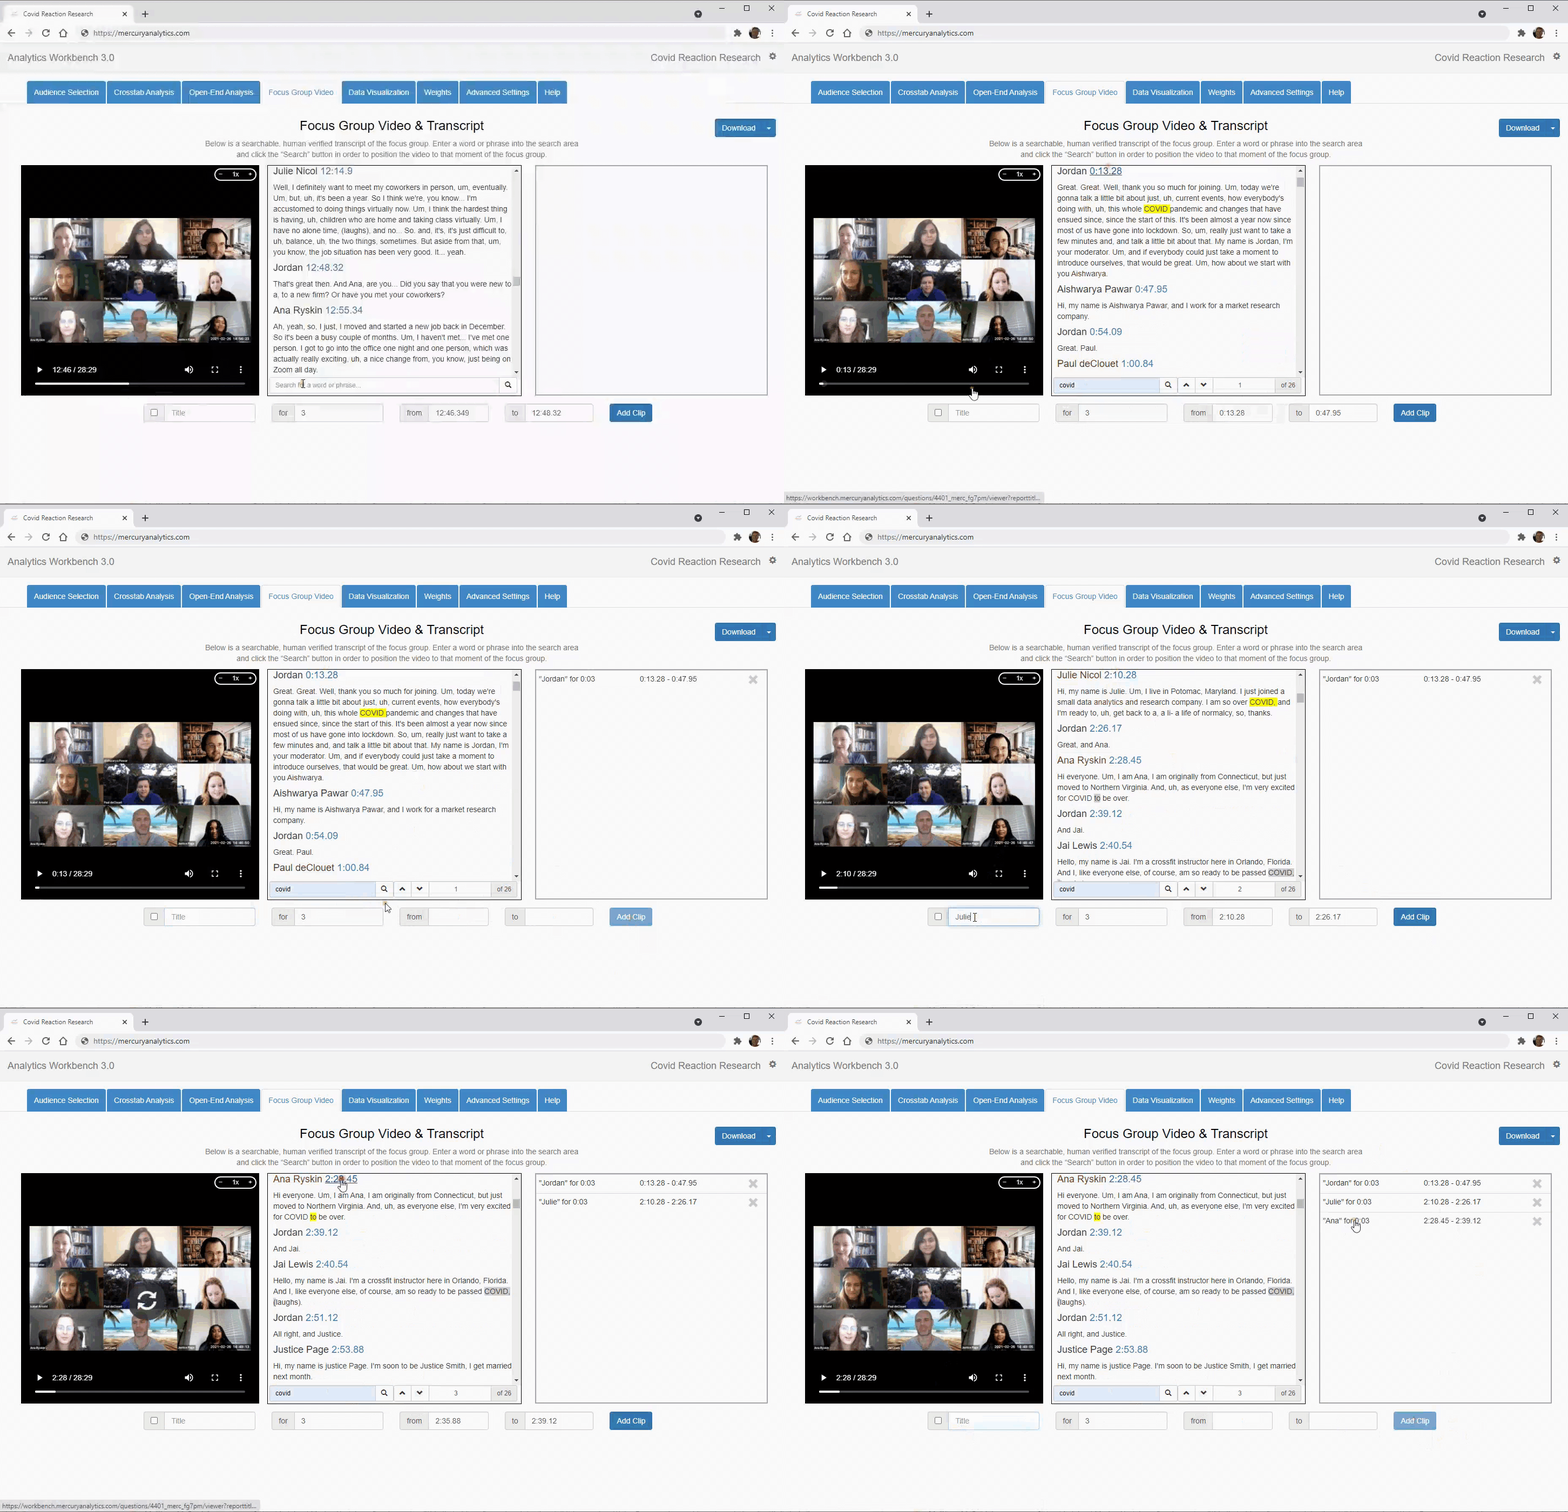
At our Analytics Workbench, rapidly review your focus group video along with a searchable AI transcript, updated within hours to a human edited transcript, that is searchable and fully synchronized at the word level to the video. Select key quotes and clips and download transcript highlights or full MP4 highlight videos. You can even upload focus group or meeting videos from any platform and enjoy the same transcript and highlighting capabilities.
Always There.
Always the Best.
Unless requested to remove a project, all of your projects live forever on the Analytics Workbench so at any time you can review or download past project questionnaires, survey results, and reports or executive summaries. Because of our in-house agile technology development group, our Analytics Workbench integrates the most sophisticated analytic methods today, and will continue to lead tomorrow.
Our clients rave about it, and we think you will, too.
Let's Connect today!
Better technology. Better Insights. Better decisions.
1120 20th St NW, Suite 350
Washington, DC 20036
202.386.6322 EXT. 2
REACH OUT
© 2022 Mercury Analytics, All Rights Reserved | Privacy Policy
